Crave InsightBENCHMARKING THE CRAVEABILITY OF BRANDS
    Miami skyline at sunset with upscale dining

    Know exactly where your brand stands

    The only platform that benchmarks local restaurant brands across social, search, experience, and media

    Scroll

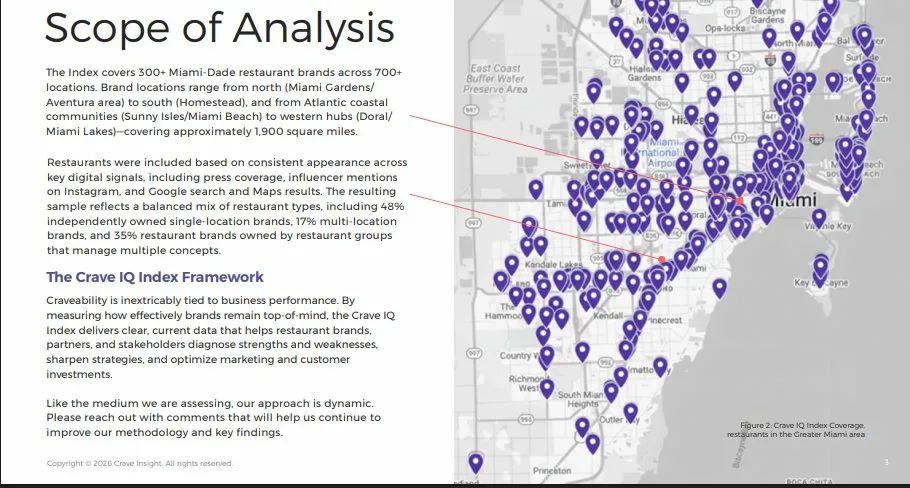
    TRACKING 350+ RESTAURANT BRANDS IN MIAMI

    Ranked brand 1
    Ranked brand 4
    Ranked brand 6
    Ranked brand 7
    Ranked brand 10
    Ranked brand 14
    Ranked brand 18
    Ranked brand 22
    Ranked brand 25
    Ranked brand 30
    Ranked brand 35
    Ranked brand 12
    Ranked brand 45
    Ranked brand 50
    Ranked brand 55
    Ranked brand 60
    Ranked brand 32
    Ranked brand 69
    Ranked brand 75
    Ranked brand 29
    Ranked brand 85
    Ranked brand 90
    Ranked brand 95
    Ranked brand 100
    Ranked brand 2
    Ranked brand 8
    Ranked brand 11
    Ranked brand 28
    Ranked brand 3
    Ranked brand 48
    Ranked brand 58
    Ranked brand 68

    Strong sales. Good reviews. Packed tables.

    But is the brand actually gaining ground — or just holding on?

    Here's how you'd know.

    Brand Scorecard
    Where you stand, at a glance
    TOTAL SCORE
    0.0
    ↑ 27.6% vs prior qtr
    Desired
    OVERALL RANK
    #0 of 398
    ↑ 91 vs prior qtr
    CATEGORY RANK
    #0 of 47
    ↑ 9 vs prior qtr
    SUBCATEGORY RANK
    #0 of 16
    ↑ 5 vs prior qtr
    Performance Trend
    Is your brand momentum compounding, or fading
    Performance Drivers
    Which channels are pulling their weight
    Social & Content
    3.93+1.27
    Digital Marketing
    3.05+0.44
    Brand Experience
    1.72-0.63
    Press & Community
    2.56+1.45
    Competitive Radar
    Where you lead, where you don't
    Your Brand Category Avg
    Competitive Landscape
    Who's ahead, who's closing in
    Rank Brand Score Δ Rank
    3 Cry Baby Creamery 128.7 ↑ 37
    4 Maman 124.1 ↑ 2
    5 The Salty 119.4 ↑ 3
    6 Caracas Bakery 119.3 ↓ 5
    7 Your BrandYOU 118.2 ↑ 9
    8 Pinecrest Bakery 117.3 ↑ 14
    9 Voodoo Doughnut 110.3 ↑ 35
    Key Insights
    What moved
    ▲ Leading in Press & Community
    Scoring 2.56 vs category avg 1.11 — a +1.45 advantage.
    ▼ Opportunity: Brand Experience
    Scoring 1.72 vs category avg 2.35. Closing this gap could boost rank.
    ▲ Strong Momentum
    Climbed 91 overall positions, driven by +27.6% score change.
    Key Highlights
    The why behind your numbers
    1
    📈 Q1 was powered by a coordinated multi-channel win built around a standout local collaboration.
    A limited-time product partnership drove the brand's biggest social moments of the quarter, sparked influencer chatter, and earned CBS coverage, all while reinforcing the brand as a recognizable favorite.
    2
    📱 The brand's everyday content kept the brand feeling fun, familiar, and highly shareable.
    Daily Instagram posts mixed nostalgia, humor, insider Miami references, and limited-time urgency, helping the brand generate roughly 57,000 interactions across Q1.
    3
    ⭐ Compared with a key local competitor, the brand is outpacing in almost every brand-owned dimension.
    They post more, engage more, earn more press, and are building cross-brand partnerships that outperforms the majority of brands in the category.
    See the Full Dashboard →

    Track your score, rank, and competitive position across every period.

    WHAT THIS MEANS FOR YOU

    Less guessing, more clarity on what's driving brand performance.

    Monitor brand mentions and performance online
    Hold your teams and vendors accountable
    Allocate investments more effectively

    Restaurant Business Magazine · Top 100 Independents 2025

    0 of 12

    of the Highest-grossing Miami restaurants are ranked in the Crave IQ top 100

    The brands driving the most revenue are the same ones driving the most brand visibility. That's not a coincidence, it's measurable.

    Client Testimonials

    "Their platform gave us real visibility into what actually drives brand performance."

    Crave Insight brought a level of clarity and discipline to our marketing that is rarely seen. Their platform gave us real visibility into what actually drives brand performance, not just surface level metrics.

    More importantly, their approach helped us separate signal from noise. It allowed us to prioritize initiatives that truly move demand and strengthen brand equity, rather than relying on assumptions or fragmented data.

    For any organization serious about understanding what works, what doesn’t, and what actually drives revenue, the CraveIQ Index is a must.

    Ben Linero headshot

    Ben Linero

    CMO, Vicky Bakery

    Vicky Bakery logo

    Beyond Your Brand

    Comprehensive market research you can use to evaluate, plan, and invest with confidence

    Data Briefs

    Quick, visual snapshots of specific brand signals

    Miami's Highest Rated Restaurants Right Now
    March 2026
    #RestaurantRating
    1Bistro II14.8 /15
    2Sushi | Bar14.7 /15
    3Mila Omakase14.6 /15
    4Cotoa14.4 /15
    5Fratellino Ristorante14.4 /15
    6Momi Market14.4 /15
    7Sushi Yasu Tanaka14.4 /15
    8Barra Callao14.3 /15
    9Domaselo14.3 /15
    10Double Knot14.3 /15

    Insightful reads on notable factoids, metrics, and indicators, like top-rated restaurants, most-searched brands, or influencer mention leaders.

    Pulse Check

    Recurring deep-dives into performance, trends, and competitive shifts

    Biggest Risers and Fallers — Q1 2026 market intelligence report

    Periodic research drops covering the biggest brand movers, emerging trends, and competitive dynamics across Miami's restaurant landscape. See who's surging, who's slipping, and why.

    Crave IQ Index™

    The most complete benchmark of local restaurant brand performance in the market

    Crave IQ Index — Scope of Analysis covering Miami-Dade restaurant brands

    The full annual ranking of every tracked brand in the market, scored and benchmarked across social, search, experience, and press. The most comprehensive view of competitive performance available.

    Ready to Get Started?

    Start tracking your brand today

    Book a 20-minute walkthrough and we'll show you your full dashboard using your brand's actual data, scores, and competitive benchmarks.

    No commitment required · 350+ brands tracked · Updated monthly